Stock Market: Predicting Future Price Moves
February 20, 2013 at 3:42 am Leave a comment
Technical analysis is used to predict a future happening on the price chart. At this point, two different theories should be iterated:
One says, there is a price behavior, which repeats itself. Examples would be, head and shoulders, flag patterns, cup and handle and many others are patterns that are recorded and assumed that they repeat themselves. Our studies and documentation show that the probability of those assumed patterns to conclude in the desired prediction is in the range of 55% – 57%. The other theory states that price behavior is random and cannot be predicted. Those models are often based on the “De Finetti Theory”, which states that probability does not exist in an objective sense. Rather probability exists only subjectively within the minds of individuals. With NeverLossTrading, we do not go that far and we rather relate to a random price distribution as it is expressed in a “Markov Chain”, where the price development is random, but in the vicinity of an expected statistical price distribution.
How does NeverLossTrading fit into this?
You will find both theories considered, while an independent price behavior model was chosen:
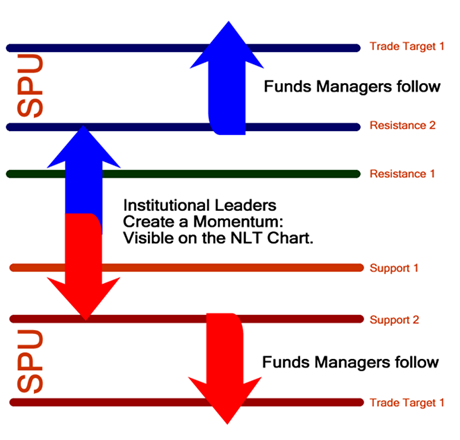
Key to the NeverLossTrading pricing model is the institutional engagement in an asset, which is detected and reported. Assuming “crowd behavior”: Followers are jumping on the chosen direction of leaders and a confirmed entry price level is defined. By the predicted price distribution of 1-SPU (Speed Unit), a future price-point in the natural distribution of prices (Markov) is extrapolated and traded. The trade orientation is rather short-term and does not follow long-term price patterns like head and shoulders: Individual price moves to the up and downside are traded.
With our mathematical models and software programs, we measure the setup stage of a price move:
First, prices accumulate prior to a price move and our indicators are identifying this stage by measuring price-, volume- and volatility development, with the NLT-specific market pressure model. In the next phase, -prices test the high/low of a price-range prior to breakout. Again, our sensors are triggered and alarm us. Next, the price breakout is noticed by key market participants and is either confirmed – and we trade along with it or not confirmed – and we stay out of the trade.
With NeverLossTrading, we built a natural behavior model, which considers repetitive action in behavior of leaders and “crowd behavior”: The crowed is following the leaders. With our mathematical models, we translated this into a trading plan, which gives us defined entries and exits. As an example, the price behavior on the chart is sectioned in: “Purple Zones”, which define times where a rather random price behavior with counter trade activities is expected and “Outside Purple Zones”: When specified institutional activity is detected, directional price moves are traded.
- Blue to the upside
- Red to the downside
 With that, NeverLossTrading has its individual model of price behavior and uses independent and proprietary indicators to measure the desired effects and approximates their outcome, resulting in high probability trading.
When you are serious in being part of this program: contact@NeverLossTrading.com
Entry filed under: Financial Market Investment, Investor Education, Price Prediction, Stock Market, Technical Analysis. Tags: Investor Education, Market Outlook, Never Loss Trading, NeverLossTrading, Sock Market, Trading.

Trackback this post | Subscribe to the comments via RSS Feed